Based on the many curative products and services in the market, likely no one will be surprised to hear pool owners continue to experience a significant number of problems with their water. But could that have the potential to aggravate consumers to the point of creating ill will and hindering new pool growth? Until now, it's been difficult to quantify the problem.
In March, Xmente Direct conducted a survey of owners of inground residential swimming pools in Florida and California (see sidebar for survey methodology). The goal was to gain fresh insight as to the level and type of problems that do-it-yourself consumers are having with their pool water. Some of the key findings:
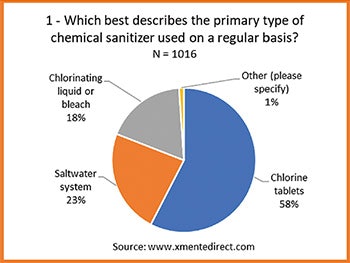
58% of DIY outdoor inground pool owners use chlorine tablets as their primary sanitizer.
 Click to enlarge
The survey specified chlorine tablets used in a floating dispenser, in skimmers or in an inline chlorinator near the pump. As a result, it is reasonable to infer these are trichlor tablets. Chart 1 provides results which are in accord with general expectations of these two geographic markets (Florida and California) and show that 58% of survey respondents used chlorine tablets, 23% used a saltwater system and 18% used liquid chlorine.
47% of DIY pool owners say they had a problem with their pool water this past year.
 Click to enlarge
Chart 2 includes users of all three types of primary sanitizers. It shows that while 47% had a problem in the past year, 65% report they had pool water problems in the last 3 years. Either way, the evidence shows that a significant number of pool owners say they are experiencing problems each year. Our sample size for this drill-down question totaled 969 qualified respondents in two important markets and results in a 95% confidence level with a margin of error of +/- 3%. That means the inground pool owner population in Florida and California would pick the same answers 95 out of 100 times within 3 percentage points of the results in chart 2.
Users of all three primary sanitizers saw significant problems last year.
Next we sought to compare overall incident level based on sanitizer delivery method. While nearly half of users had a problem, there was little difference between the types of chlorine sanitizer delivery — salt, tabs or liquid. That is, all had significant problems.
RELATED: The Science of Starving Algae
 Click to enlarge
Chart 3 shows that between 42% and 49% of respondents had a problem during the last year depending on the chlorine delivery method they used. Based on this evidence it is reasonable to infer that pool water problems are experienced universally, regardless of the sanitizing method used (among these three).
But just what are the problems from a consumer viewpoint? And what is the relationship to the sanitizer, if any? Understanding that is the next step.
65% of users with problems in the past year experienced cloudy and/or green water.
 Click to enlarge
Chart 4 shows that cloudy and/or green water clearly lead the list of problems reported by 65% of respondents. With the sample size of 422, the margin of error was quite small at +/- 5%.
Cloudy or green water can be due to a variety of problems. For example, it might be caused by an equipment malfunction, contaminants in the water, a low sanitizer level, a chemical balance problem or a combination of factors. We were able to remove those pool owners who identified an equipment malfunction from the total. Of the 65% that reported cloudy and/or green water, 53% did not report an equipment malfunction. That's still huge.
It's no surprise that cloudy and/or green water would be the most common problems experienced by pool owners; the significance is in the scope of the problem — the sheer numbers involved. Almost half of the pool owners had a problem last year and 65% of those experienced cloudy and/or green water. The evidence suggests that maintaining proper pool water chemistry remains a significant challenge for pool owners, whatever sanitizer is used.
70% of chlorine tablet pools with problems experienced cloudy and/ or green water during the previous year.
 Click to enlarge
Next we compared the percent of problem pools reporting cloudy and/or green water for each sanitizer. The results are in Chart 5. While still significant at 48%, saltwater pools had the lowest incident rate. Contrast that to pools using chlorine tablets, which had an incident rate of 70%.
In other words, this survey shows that chlorine tablet and liquid chlorine users experience significantly more green and/or cloudy water episodes than saltwater pools. But even saltwater pools have a high incident rate that could disillusion pool ownership.
86% of problems came from pools that were tested once a week or less frequently.
Pool water testing is often thought of as key to problem prevention. With this question we sought to understand the relationship between manual at-home water testing and pool problems.
RELATED: ABCs of Algae
 Click to enlarge
Chart 6 measures testing frequency of chlorine tablet users that had a problem during the past year. It shows that 86% tested their water once a week or less frequently. One step to prevent problems is an early warning from manual testing. Understanding, for example, that free chlorine has dropped below the minimum level and taking immediate corrective action can avoid cloudy and green water. But regular testing frequency is not a common practice by this group and could correlate with pool water problems.
Here are some other testing attributes of users that had problems last year:
- 66% agree that manual pool water testing is easy.
- Only 26% agree that daily pool water testing will prevent more problems than weekly testing.
- 44% agree they sometimes forget to test their pool routinely.
Conclusion/Key Findings
In his June 2019 AQUA Magazine article, "The Great Cyanuric Acid Debate," Eric Herman reported on the industry's discussion of pros and cons of current cyanuric acid usage levels. On one hand there are technical experts who advise a change in the way the industry approaches the use of CYA. They recommend CYA and FC be maintained within a certain ratio. (The target ratio for CYA and FC is still the subject of debate.) Advice from this quarter might be summarized: "If the CYA level goes up and the FC level is not raised to compensate, there may not be enough FC to kill algae." Which would result in the type of cloudy water/algae problem this survey has uncovered.
On the other side are proponents of traditional CYA and chlorine usage levels that argue for the status quo, saying "there is no evidence to show there's a problem."
Well, that has now changed. This survey provides evidence that a problem exists for chlorine tablet users, one that has likely been around for quite a long time. Is the green and/or cloudy water problem a "smoking gun" pointed at high cyanuric acid levels, or are there other unrelated causal agents at work? Other sources of data could shed more light on the issue, including retail pool water test data and online pool water help sites. Having a third party with no vested interest in the outcome analyze this data could help advance an informed discussion in this industry.
This report is intended to follow the evidence wherever it leads. I look forward to fielding any questions and expanding the industry dialogue. The evidence presented infers the following are overriding issues for pool owners in Florida and California:
RELATED: The Great Cyanurate Debate
- Managing pool water chemistry to reduce or eliminate undesirable incidents remains a problem for a significant number of pool owners.
- Pool owners either do not fully understand the relationship between accurate and frequent water testing and avoiding pool water problems, or are not motivated to do so.
Within every problem lies an opportunity!
MethodologyThe survey was designed to deliver a high level of confidence in the results. The simple fact is that many surveys are just not reliable. That's understandable because they are not based on standards designed to reflect the target market. Rather, they are informally gathered samples that never considered how to represent the target population. While not claiming to be perfect, this survey is intended to produce a high confidence level. Here are the key design elements:
Florida and California were selected due to their positions as the top two inground pool markets (representing approximately 43% of the in-ground pools) and to optimize initial project cost. Accordingly, insights in this report are based solely on those two states. The sample size of 1,213 allows analysis of questions in detail while delivering a 95% confidence level within a margin of error of +/- 5% for reported results (unless otherwise noted). The number of respondents to each question is denoted by "N = a number" on each chart. Survey responses in this article focus on outdoor inground pools. They are maintained solely by the respondent or their spouse, child or family member (DIY pools). Pools on weekly cleaning service are excluded except where noted for comparison. |
Larry Bloom’s experience in the pool and spa industry spans 35 years. He was president and later CEO of BioLab, and served as chairman of the Manufacturers’ Council and the NSPI (ancestor of PHTA) Board of Directors. He has a Bachelor of Science Degree in Chemical Engineering from the Georgia Institute of Technology. He is co-founder of the Xmente Swimming Pool Retail Academy, where he currently works.


