
The residential pool and hot tub segments are fond of making comparisons with the RV industry. And in certain ways, they are similar: Both industries are big ticket discretionary purchases. Both rely to a certain extent on lifestyle enhancement to entice ownership. And the combined average price among all classes of recreational vehicles is somewhat equal to that of an inground pool, roughly $35,000.
RELATED: RVs and Boats — Competition for Discretionary Dollars
But there is one measure by which the two sectors are distinctly different: post-recession recovery. As we are about to discover, recreational vehicles, as well as boats, vacation travel, housing starts, and other comparables have enjoyed a brisk return to their pre-recession pinnacles while pools and hot tubs, alas, have not.
Is there a reason? Quoting the Magic 8-Ball, “Signs point to yes.”
The Housing Gap
Until the recession, the pool construction business tracked closely with new home starts in terms of growth. Since the recession, however, they have gone their separate ways.
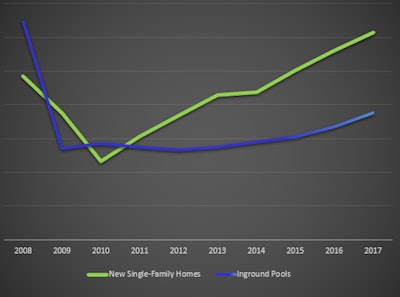
Exhibit 1: New single-family home sales vs new inground pool construction, 2008-2017. Source: U.S. Census Bureau; Pkdata.
One reason for the pool industry’s lackluster recovery is that new pools are not as closely tied to new homes. Before the recession, nearly 60% of new pools were built in conjunction with a new home, with the other 40% or so being added to an existing house. Today that relationship is reversed, with retrofit pools representing the majority.
Boats and RVs
A similar story applies to the marine and recreational vehicle industries. Both powerboats and motorhomes have significantly outpaced the inground pool segment.
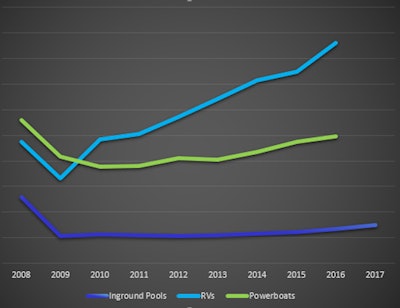
Exhibit 2: Recreational vehicle and powerboat sales vs new pool construction, 2008-2017. Source: Recreational Vehicle Industry Association; National Marine Manufacturers Association; Pkdata.
What are they doing that the pool industry is not? One answer starts with the letter “A”. (Hint: Rhymes with “advertising”.)
Comparative Advertising-to-Sales Ratios
One indication of an industry’s predisposition toward growth is its advertising-to-sales ratio, expressed as the percentage of gross industry revenue that is spent on advertising to the consumer (and not within the channel). This includes all media from television to outdoor boards to online banners.
For many years the leading consumer category was alcoholic beverages, which today averages 15.6%. But recently even that lofty number has been supplanted by the pharmaceutical industry at 19.6%. That means that one out of every five dollars in pharma revenue goes back into direct to consumer promotion.
Closer to home, the ratios are a little more down to earth.
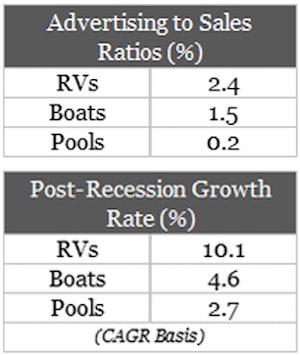
We periodically work with an outside media buying service to estimate the value of the pool industry’s direct to consumer advertising using spot markets and measured online coverage to arrive at a national total.
If there is a cause and effect message as to why RV’s and boats outperform pools, perhaps this is it. Seen another way, note the comparative growth rates for all three sectors to the right.
Exhibit 3 (right): Advertising-to-sales ratios for select industries. Source: Nielsen Media; Pkdata.
Bloomberg Businessweek recently reported on the state of industry “checkoff fees,” the mandatory assessments that associations such as the Cattleman’s Beef Board and the National Dairy Promotion & Research Board assess their members for promotional campaigns like “Got Milk?” and “Beef. It’s what’s for dinner.” So, for example, for an average head of cattle selling for $1,400, $1 goes into the promotional fund. Pretty affordable, right?
But do those campaigns really work? According to a study by Texas A&M University: on average, each dollar spent by these various promotion boards (including such obscure ones as the Avocado Board and the National Mango Board) yields $9 in additional sales.
Okay, so backyard pools aren’t avocados or mangos. But when we see that RV’s spend 12 times what the pool industry spends and has four times the growth, and boats spend seven times pools and has nearly twice the growth, perhaps it’s time to think about a great collective effort to raise the awareness of, and demand for, the pool — and hot tub — lifestyle.
Besides, pools and hot tubs are sexier than avocados.
Pkdata is an Atlanta market research firm that has tracked the residential and commercial pool and spa industry since 1992. To date the firm has completed over 400 studies among consumers, manufacturers, dealers, builders and service companies. Its annual industry statistics reports are widely used as planning tools by principal stakeholders globally.


