In my last post, I promised to share a case study to help retailers identify and prioritize ways to improve customer retention and win-back. But first, a word of caution. When it comes to winning back lost customers, it pays to be choosey. Not all lost customers make good win-back prospects, nor do you want to spend resources trying to regain every lost customer. Instead, focus on those with the best return on your efforts. i
Without an effective analytical process and strategy, you can waste lots of time and money contacting lost customers who are poor prospects for future business. On the flip side, doing nothing to win back lost customers will almost always be detrimental to your success. Done correctly, you can win back valuable lost customers and reduce defection rates in the future.
The process
1. Analyze point-of-sale data to identify your most desirable lost customers.
2. Survey desirable lost customers to uncover the reasons why they have defected.
3. Use the knowledge to improve your business, develop “save” efforts for at-risk customers and create reactivation promotions to win back desirable lost customers.
Let's dig into the process step by step. After reading, feel free to try it on your own and contact us if you have questions.
Step One: Use point-of-sale analysis to segment customers
The first step is to identify customers who have not purchased in 12 months or have a significant drop in sales. We call these “underperformers.” When doing this, we prefer to use the most recent 12 months as of the end of the pool season (August, for example) as the reference point. This way, we don’t let too much time pass for these “lost souls” so we achieve higher quality survey results and a better chance of winning them back next season (or even this season!).
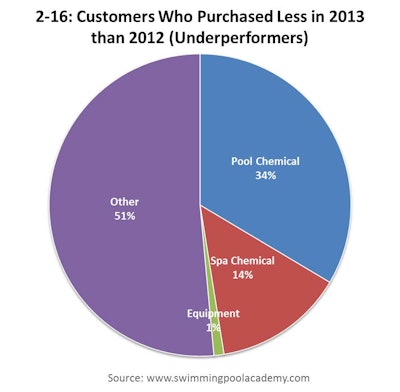
Next, we screen this list of “underperformers” based on their actual purchases, identifying those that buy products that lend themselves to desirable repeat purchases. Chart 2-16 shows the results for one of our case study clients.

Results
In this case we found that 34 percent of the underperformers had purchased pool chemicals. This is an attractive win-back segment for several reasons. These former customers have pools, and pool chemicals lend themselves to repeat purchases. Group members are sufficiently similar (they all purchase the same types of products), so survey results will be meaningful and not diluted. This similarity also allows for targeted direct marketing efforts.
As we continued the point-of-sale analysis for the pool chemical underperformers, we found the following:
- 49 percent were lost, meaning they made no purchases in the most recent 12 months.
- 40 percent of the lost customers accounted for 80 percent of the lost sales.
- The list contained some loyal customers who had previously purchased for two years in a row (48 percent) and some that had purchased for three years in a row (32 percent) or more.
Next step
Now that a desirable target group of lost customers was identified, we moved forward to develop and implement a survey that segmented these lost customers by reason for defection. Stay tuned for my next post to learn more.
Your turn
Have you ever analyzed your point-of-sale data to identify your most desirable lost customers? What did you find? If not, what are your thoughts about this exercise? What methods do you use to learn about why you have lost customers? How have you applied that knowledge to improve your business? What kind of help could you use?
Read the previous post in this series: The Benefit of Talking to Lost Customers


