Zodiac’s Steve Gutai has spent his career educating builders and servicers on the fine points of hydraulics, system design and equipment selection. As he points out here, the first step down the path toward energy efficiency is learning how to read charts that define a pump’s performance characteristics.
Whether out of a desire to conserve natural resources or simply save money on monthly utility bills, energy efficiency is on the mind of today’s pool owner. As concerns over carbon footprints grow and the cost of energy increases, there’s little doubt that creating efficient systems will remain a priority for pool professionals in the years to come.
Of the many ways to save energy, perhaps the most crucial is through hydraulic efficiency — that is, by building a system where the pump’s performance characteristics are in balance with the resistance in a given plumbing system at the desired flow rate.
Whether it’s new construction or replacing a pump on existing systems, selecting the right pump is one of the most important decisions you will make when it comes to hydraulic efficiency. To hit that mark, you have to be able to read and apply the information found on pump performance charts.
If you find yourself somewhat mystified by pump curves and performance charts, or if you need to train someone about hydraulic efficiency, here’s a brief primer to get you started.
Pump Performance Curves

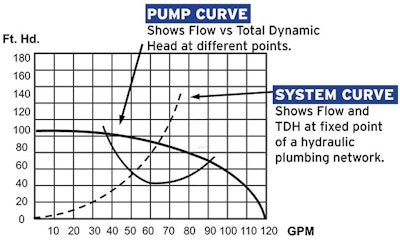
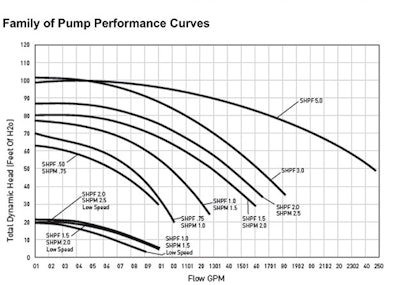
A pump curve shows the pump’s flow at specific operating points of resistance defined as TDH. It’s important to understand that the pump can only operate at a single point at a time. Each pump has it own unique curve based on horsepower rating and application (low versus high head).

It’s common to see a family of single- or two-speed pump curves representing different horsepower ratings on a single chart. Note: If you need to convert TDH to pressure, simply multiply feet of head by .433 to get PSI.
System Curves

A system curve can be defined as the relationship between flow and head in a fixed hydraulic network. Depending on its horsepower, size or speed, a pump can operate at any point up or down the system curve. The larger the pump (or faster the speed), the more flow we put into the system — and as a result, the higher the resistance in that fixed system.
Each of the three systems curves used by APSP/T24, EPA etc., represents a standard plumbing system. Curve A represents 2-inch, Curve B 1.5-inch, and Curve C represents 2.5-inch plumbing networks.
At each pump curve intersection, the flow and TDH is fixed. Different pumps that operate with different pump curves will all operate along the system curves but at different fixed points.
The main advantage of a variable speed pump is its ability to operate at many different points.
Multiple Speeds

This chart shows how a basic performance curve of a variable speed pump will intersect the system curve at different speeds expressed in RPM. The faster or the higher the pump speed, the more flow and head the pump will generate — thus you’re working up the system curve. Conversely, the lower the pump speed, the lower the flow and head the pump is generating, meaning you’re working down the system curve.
Need to Know
Selecting the right pump for the job not only means understanding a basic pump curve, but more importantly it means understanding how the pump curve relates to the system curve — the point where the pump curve and the system curve intersect.
In the real world we see this applied to either the choice of a new pump on a newly designed pool, or a replacement pump on an existing system. Understanding the use of system curves is important because energy codes have adopted the system curve methodology, i.e. APSP Energy Star & CEC T20.
In conclusion, using this methodology will prove extraordinarily useful in ensuring your clients’ systems are efficient, serviceable and safe.
Comments or thoughts on this article? Please e-mail [email protected].


