We always say that pool construction tracks closely with housing starts, and historically that has always been the case. But is that still true? And are there other economic indicators that are as correlative with the state of the pool industry?
Indeed, pools have tracked with housing starts. But then, in 2011, things began to change. Starts stopped prompting pools. Moreover, two new indicators began to explain a lot of things about the floundering pool business.
Fits and Starts
In the past, residential housing starts used to be a reasonably reliable predictor of new pool construction. Fifteen years ago, some 60% of all new pools were built in conjunction with a new house. That all stopped when the euphoria of the housing bubble suddenly imploded. Fewer spec homes were built and even far fewer spec pools were constructed. Moreover, the new homes that were built tended to minimize the amenities — including pools — to save money. As a consequence, of the few pools that were installed, 60% were additions to existing homes.
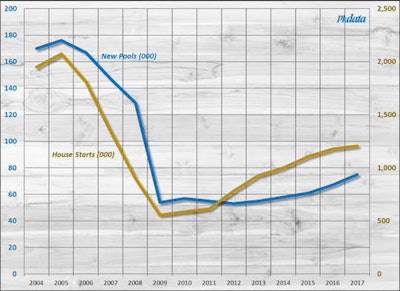
 New inground pool construction vs private family housing starts, 2004-2017. Source: U.S. Bureau of the Census and U.S. Department of Housing and Urban Development; Pkdata
In the chart above we show the 13-year relationship between housing starts and the construction of new pools in the U.S. The lines do appear to fit almost right up to the present. But this depiction is somewhat misleading owing to the use of double vertical axes in order to accommodate disparate values.
 New inground pool construction vs private family housing starts, 2004-2017. Source: U.S. Bureau of the Census and U.S. Department of Housing and Urban Development; Pkdata.
Here is the same data summarized as simple polynomial trend lines. With this technique it is a lot easier to see how housing starts are rebounding to a much greater extent than pools. Gone (for now) are the days of cheap mortgage money. And the collateral damage falls within the pool industry.
Rise and Fall of Home Ownership
The same coattail effect that has new pools associated with house starts has also been applied to homeownership rates.
 New inground pool construction vs rate of homeownership, 2004-2017. Source: U.S. Bureau of the Census and U.S. Department of Housing and Urban Development; Pkdata.
More than one industry watcher has speculated that the lagging recovery in pool construction has been in part the result of the well-publicized decline in homeownership. Judging from the above graphic, there does seem to be some concurrency. But again, looks — or graphs — can be deceiving. In this case, one only needs a little more perspective.
 Rate of homeownership, 1965-2017. Source: U.S. Bureau of the Census and U.S. Department of Housing and Urban Development.
It turns out that the 69.2% ownership rate seen in the previous chart beginning in 2004 was in fact the highest level attained in the modern era of residential swimming pool construction. Moreover, the 62.9% nadir recorded in 2016 was the lowest since 1965. So much for that.
Losing Share of Wallet
But beside home starts, another measure of how the industry is losing ground is the comparison between new pools and disposable income.
 New pool construction vs real personal disposable income, 2004-2017. Source: U.S. Bureau of Economic Analysis; Pkdata.
Disposable income is the amount of money that households have available for spending after income taxes. It is a key metric for industries associated with big-ticket discretionary purchases such as the pool and hot tub business for obvious reasons. Since 2004, real personal disposable income has increased 9.7% while new pool construction has climbed 31.6%. That sounds really good, but once again the total context is missing.
 New pool construction vs real personal disposable income, 2004-2017. Source: U.S. Bureau of Economic Analysis; Pkdata.
The longer-term trend shows that the gap between the real growth of disposable income and pools has been increasing. In marketing terms this is known as share of wallet. The clear implication is that discretionary dollars are going elsewhere. And, in fact, this turns out to be true. As we have previously pointed out, industries such as travel, recreational vehicles and boating are all doing rather well at the moment.
Want More Data?To learn more about the pool industry, including the residential/commercial markets, hot tubs, pool equipment and chemicals, check out Pkdata's complete 2017 market research collection. These reports feature extensive market research, including consuming data, sales trends, channel intelligence, international reports and more. To learn more, click here. |
A recent Wall Street Journal poll of economists drew the not so startling conclusion that we are due for another recession. Interest rates are already going up, largely in response to a comparatively vibrant job market. That in turn usually signals a more robust pattern of consumer spending, which should provide a commensurate uplift to the pool/spa business.
So, 2018 appears to be a pivotal year. Let’s hope for another strong showing.
Pkdata is an Atlanta market research firm that has tracked the residential and commercial pool and spa industry since 1992. To date the firm has completed over 400 studies among consumers, manufacturers, dealers, builders and service companies. Its annual industry statistics reports are widely used as planning tools by principal stakeholders globally.


